| Type: | Package |
| Title: | Matrix eQTL: Ultra Fast eQTL Analysis via Large Matrix Operations |
| Version: | 2.3 |
| Date: | 2019-12-04 |
| Description: | Matrix eQTL is designed for fast eQTL analysis on large datasets. Matrix eQTL can test for association between genotype and gene expression using linear regression with either additive or ANOVA genotype effects. The models can include covariates to account for factors as population stratification, gender, and clinical variables. It also supports models with heteroscedastic and/or correlated errors, false discovery rate estimation and separate treatment of local (cis) and distant (trans) eQTLs. For more details see Shabalin (2012) <doi:10.1093/bioinformatics/bts163>. |
| License: | LGPL-3 |
| LazyLoad: | yes |
| BugReports: | https://github.com/andreyshabalin/MatrixEQTL/issues |
| URL: | http://www.bios.unc.edu/research/genomic_software/Matrix_eQTL/ |
| Depends: | R (≥ 2.12.0), methods, utils, graphics, stats |
| NeedsCompilation: | no |
| Packaged: | 2019-12-05 00:23:41 UTC; Andrey |
| Author: | Andrey A Shabalin  [aut, cre]
 |
| Maintainer: | Andrey A Shabalin <andrey.shabalin@gmail.com> |
| Repository: | CRAN |
| Date/Publication: | 2019-12-22 10:06:37 UTC |
Matrix eQTL: Ultra Fast eQTL Analysis via Large Matrix Operations
Description
Matrix eQTL is designed for fast eQTL analysis of large datasets. Matrix eQTL can test for association between genotype and gene expression using linear regression with either additive or ANOVA (additive and dominant) genotype effects. The models can include covariates to account for such factors as population stratification, gender, clinical variables, and surrogate variables. Matrix eQTL also supports models with heteroscedastic and/or correlated errors, false discovery rate estimation and separate treatment of local (cis) and distant (trans) eQTLs.
Details
| Package: | MatrixEQTL |
| Type: | Package |
| License: | LGPL-3 |
| LazyLoad: | yes |
| Depends: | methods |
Author(s)
Andrey A Shabalin andrey.shabalin@gmail.com
Maintainer: Andrey A Shabalin <andrey.shabalin@gmail.com>
References
The package website: http://www.bios.unc.edu/research/genomic_software/Matrix_eQTL/
See Also
See Matrix_eQTL_engine for reference and sample code.
Artificial data for Matrix eQTL sample code: Covariates.
Description
Artificial data set with 2 covariates across 15 samples. Columns of the file must match to those of the expression and genotype data sets.
Format
| id | Sam_01 | Sam_02 | ... |
| gender | 0 | 0 | ... |
| age | 40 | 46 | ... |
Author(s)
Andrey A Shabalin andrey.shabalin@gmail.com
References
The package website: http://www.bios.unc.edu/research/genomic_software/Matrix_eQTL/
See Also
See Matrix_eQTL_engine for reference and sample code.
Artificial data for Matrix eQTL sample code: Gene expression.
Description
Artificial data set with expression of 10 genes across 15 samples. Columns of the file must match to those of the genotype and covariates data sets.
Format
| geneid | Sam_01 | Sam_02 | ... |
| Gene_01 | 4.91 | 4.63 | ... |
| Gene_02 | 13.78 | 13.14 | ... |
| ... | ... | ... | ... |
Author(s)
Andrey A Shabalin andrey.shabalin@gmail.com
References
The package website: http://www.bios.unc.edu/research/genomic_software/Matrix_eQTL/
See Also
See Matrix_eQTL_engine for reference and sample code.
Sample code for cis/trans-eQTL analysis with Matrix eQTL
Description
The following code is the best starting point for those who want to perform cis-/trans-eQTL analysis with Matrix eQTL.
Author(s)
Andrey A Shabalin andrey.shabalin@gmail.com
References
The package website: http://www.bios.unc.edu/research/genomic_software/Matrix_eQTL/
See Also
See Matrix_eQTL_engine for reference and other sample code.
Examples
# Matrix eQTL by Andrey A. Shabalin
# http://www.bios.unc.edu/research/genomic_software/Matrix_eQTL/
#
# Be sure to use an up to date version of R and Matrix eQTL.

# source("Matrix_eQTL_R/Matrix_eQTL_engine.r");
library(MatrixEQTL)

## Location of the package with the data files.
base.dir = find.package('MatrixEQTL');

## Settings

# Linear model to use, modelANOVA, modelLINEAR, or modelLINEAR_CROSS
useModel = modelLINEAR; # modelANOVA, modelLINEAR, or modelLINEAR_CROSS

# Genotype file name
SNP_file_name = paste0(base.dir, "/data/SNP.txt");
snps_location_file_name = paste0(base.dir, "/data/snpsloc.txt");

# Gene expression file name
expression_file_name = paste0(base.dir, "/data/GE.txt");
gene_location_file_name = paste0(base.dir, "/data/geneloc.txt");

# Covariates file name
# Set to character() for no covariates
covariates_file_name = paste0(base.dir, "/data/Covariates.txt");

# Output file name
output_file_name_cis = tempfile();
output_file_name_tra = tempfile();

# Only associations significant at this level will be saved
pvOutputThreshold_cis = 2e-2;
pvOutputThreshold_tra = 1e-2;

# Error covariance matrix
# Set to numeric() for identity.
errorCovariance = numeric();
# errorCovariance = read.table("Sample_Data/errorCovariance.txt");

# Distance for local gene-SNP pairs
cisDist = 1e6;

## Load genotype data

snps = SlicedData$new();
snps$fileDelimiter = "\t";      # the TAB character
snps$fileOmitCharacters = "NA"; # denote missing values;
snps$fileSkipRows = 1;          # one row of column labels
snps$fileSkipColumns = 1;       # one column of row labels
snps$fileSliceSize = 2000;      # read file in slices of 2,000 rows
snps$LoadFile(SNP_file_name);

## Load gene expression data

gene = SlicedData$new();
gene$fileDelimiter = "\t";      # the TAB character
gene$fileOmitCharacters = "NA"; # denote missing values;
gene$fileSkipRows = 1;          # one row of column labels
gene$fileSkipColumns = 1;       # one column of row labels
gene$fileSliceSize = 2000;      # read file in slices of 2,000 rows
gene$LoadFile(expression_file_name);

## Load covariates

cvrt = SlicedData$new();
cvrt$fileDelimiter = "\t";      # the TAB character
cvrt$fileOmitCharacters = "NA"; # denote missing values;
cvrt$fileSkipRows = 1;          # one row of column labels
cvrt$fileSkipColumns = 1;       # one column of row labels
if(length(covariates_file_name)>0) {
  cvrt$LoadFile(covariates_file_name);
}

## Run the analysis
snpspos = read.table(snps_location_file_name, header = TRUE, stringsAsFactors = FALSE);
genepos = read.table(gene_location_file_name, header = TRUE, stringsAsFactors = FALSE);

me = Matrix_eQTL_main(
    snps = snps,
    gene = gene,
    cvrt = cvrt,
    output_file_name      = output_file_name_tra,
    pvOutputThreshold     = pvOutputThreshold_tra,
    useModel = useModel,
    errorCovariance = errorCovariance,
    verbose = TRUE,
    output_file_name.cis  = output_file_name_cis,
    pvOutputThreshold.cis = pvOutputThreshold_cis,
    snpspos = snpspos,
    genepos = genepos,
    cisDist = cisDist,
    pvalue.hist = TRUE,
    min.pv.by.genesnp = FALSE,
    noFDRsaveMemory = FALSE);

unlink(output_file_name_tra);
unlink(output_file_name_cis);

## Results:

cat('Analysis done in: ', me$time.in.sec, ' seconds', '\n');
cat('Detected local eQTLs:', '\n');
show(me$cis$eqtls)
cat('Detected distant eQTLs:', '\n');
show(me$trans$eqtls)

## Make the histogram of local and distant p-values

plot(me)
Main function for fast eQTL analysis in MatrixEQTL package
Description
Matrix_eQTL_engine function tests association of
every row of the snps dataset with every row of the
gene dataset using a linear regression model
defined by the useModel parameter (see below).
The testing procedure accounts for extra
covariates specified by the cvrt parameter.
The errorCovariance parameter can be set to the
error variance-covariance matrix to account
for heteroskedastic and/or correlated errors.
Associations significant at pvOutputThreshold
(pvOutputThreshold.cis) levels are saved to
output_file_name (output_file_name.cis),
with corresponding estimates of effect size (slope coefficient),
test statistics, p-values, and q-values (false discovery rate).
Matrix eQTL can perform separate analysis for
local (cis) and distant (trans) eQTLs.
For such analysis one has to set the cis-analysis specific
parameters pvOutputThreshold.cis > 0,
cisDist, snpspos and
genepos in the call of Matrix_eQTL_main function.
A gene-SNP pair is considered local if the
distance between them is less or equal to cisDist.
The genomic location of genes and SNPs is defined by
the data frames snpspos and genepos.
Depending on p-value thresholds pvOutputThreshold and
pvOutputThreshold.cis Matrix eQTL runs in
one of three different modes:
Set
pvOutputThreshold > 0andpvOutputThreshold.cis = 0(or useMatrix_eQTL_engine) to perform eQTL analysis without using gene/SNP locations. Associations significant at thepvOutputThresholdlevel are be recorded inoutput_file_nameand in the returned object.Set
pvOutputThreshold = 0andpvOutputThreshold.cis > 0to perform eQTL analysis for local gene-SNP pairs only. Local associations significant atpvOutputThreshold.cislevel will be recorded inoutput_file_name.cisand in the returned object.Set
pvOutputThreshold > 0andpvOutputThreshold.cis > 0to perform eQTL analysis with separate p-value thresholds for local and distant eQTLs. Distant and local associations significant at corresponding thresholds are recorded inoutput_file_nameandoutput_file_name.cisrespectively and in the returned object. In this case the false discovery rate is calculated separately for these two sets of eQTLs.
Matrix_eQTL_engine is a wrapper for Matrix_eQTL_main
for eQTL analysis without regard to gene/SNP location and provided
for compatibility with the previous versions of the package.
The parameter pvalue.hist allows to record information sufficient
to create a histogram or QQ-plot of all the p-values
(see plot).
Usage
Matrix_eQTL_main(
        snps,
        gene,
        cvrt = SlicedData$new(),
        output_file_name = "",
        pvOutputThreshold = 1e-5,
        useModel = modelLINEAR,
        errorCovariance = numeric(),
        verbose = TRUE,
        output_file_name.cis = "",
        pvOutputThreshold.cis = 0,
        snpspos = NULL,
        genepos = NULL,
        cisDist = 1e6,
        pvalue.hist = FALSE,
        min.pv.by.genesnp = FALSE,
        noFDRsaveMemory = FALSE)

Matrix_eQTL_engine(
        snps,
        gene,
        cvrt = SlicedData$new(),
        output_file_name,
        pvOutputThreshold = 1e-5,
        useModel = modelLINEAR,
        errorCovariance = numeric(),
        verbose = TRUE,
        pvalue.hist = FALSE,
        min.pv.by.genesnp = FALSE,
        noFDRsaveMemory = FALSE)
Arguments
snps |
| |||||||||||||||||
gene |
| |||||||||||||||||
cvrt |
| |||||||||||||||||
output_file_name |
| |||||||||||||||||
output_file_name.cis |
| |||||||||||||||||
pvOutputThreshold |
| |||||||||||||||||
pvOutputThreshold.cis |
| |||||||||||||||||
useModel |
| |||||||||||||||||
errorCovariance |
| |||||||||||||||||
verbose |
| |||||||||||||||||
snpspos |
| |||||||||||||||||
genepos |
| |||||||||||||||||
cisDist |
| |||||||||||||||||
pvalue.hist |
| |||||||||||||||||
min.pv.by.genesnp |
| |||||||||||||||||
noFDRsaveMemory |
|
Details
Note that the columns of
gene, snps, and cvrt must match.
If they do not match in the input files,
use ColumnSubsample method to subset and/or reorder them.
Value
The detected eQTLs are saved in output_file_name
and/or output_file_name.cis if they are not NULL.
The method also returns a list with a summary of the performed analysis.
param |
Keeps all input parameters and also records the number of degrees of freedom for the full model. |
time.in.sec |
Time difference between the start and the end of the analysis (in seconds). |
all |
Information about all detected eQTLs. |
cis |
Information about detected local eQTLs. |
trans |
Information about detected distant eQTLs. |
The elements all, cis, and trans
may contain the following components
ntests-
Total number of tests performed. This is used for FDR calculation.
eqtls-
Data frame with recorded significant associations. Not available if
noFDRsaveMemory=FALSE neqtls-
Number of significant associations recorded.
hist.bins-
Histogram bins used for recording p-value distribution. See
pvalue.histparameter. hist.counts-
Number of p-value that fell in each histogram bin. See
pvalue.histparameter. min.pv.snps-
Vector with the best p-value for each SNP. See
min.pv.by.genesnpparameter. min.pv.gene-
Vector with the best p-value for each gene. See
min.pv.by.genesnpparameter.
Author(s)
Andrey A Shabalin andrey.shabalin@gmail.com
References
The package website: http://www.bios.unc.edu/research/genomic_software/Matrix_eQTL/
See Also
The code below is the sample code for eQTL analysis NOT using gene/SNP locations.
See MatrixEQTL_cis_code for sample code for
eQTL analysis that separates local and distant tests.
Examples
# Matrix eQTL by Andrey A. Shabalin
# http://www.bios.unc.edu/research/genomic_software/Matrix_eQTL/
#
# Be sure to use an up to date version of R and Matrix eQTL.

# source("Matrix_eQTL_R/Matrix_eQTL_engine.r");
library(MatrixEQTL)

## Location of the package with the data files.
base.dir = find.package('MatrixEQTL');

## Settings

# Linear model to use, modelANOVA, modelLINEAR, or modelLINEAR_CROSS
useModel = modelLINEAR; # modelANOVA, modelLINEAR, or modelLINEAR_CROSS

# Genotype file name
SNP_file_name = paste0(base.dir, "/data/SNP.txt");

# Gene expression file name
expression_file_name = paste0(base.dir, "/data/GE.txt");

# Covariates file name
# Set to character() for no covariates
covariates_file_name = paste0(base.dir, "/data/Covariates.txt");

# Output file name
output_file_name = tempfile();

# Only associations significant at this level will be saved
pvOutputThreshold = 1e-2;

# Error covariance matrix
# Set to numeric() for identity.
errorCovariance = numeric();
# errorCovariance = read.table("Sample_Data/errorCovariance.txt");


## Load genotype data

snps = SlicedData$new();
snps$fileDelimiter = "\t";      # the TAB character
snps$fileOmitCharacters = "NA"; # denote missing values;
snps$fileSkipRows = 1;          # one row of column labels
snps$fileSkipColumns = 1;       # one column of row labels
snps$fileSliceSize = 2000;      # read file in slices of 2,000 rows
snps$LoadFile(SNP_file_name);

## Load gene expression data

gene = SlicedData$new();
gene$fileDelimiter = "\t";      # the TAB character
gene$fileOmitCharacters = "NA"; # denote missing values;
gene$fileSkipRows = 1;          # one row of column labels
gene$fileSkipColumns = 1;       # one column of row labels
gene$fileSliceSize = 2000;      # read file in slices of 2,000 rows
gene$LoadFile(expression_file_name);

## Load covariates

cvrt = SlicedData$new();
cvrt$fileDelimiter = "\t";      # the TAB character
cvrt$fileOmitCharacters = "NA"; # denote missing values;
cvrt$fileSkipRows = 1;          # one row of column labels
cvrt$fileSkipColumns = 1;       # one column of row labels
if(length(covariates_file_name)>0){
    cvrt$LoadFile(covariates_file_name);
}

## Run the analysis

me = Matrix_eQTL_engine(
    snps = snps,
    gene = gene,
    cvrt = cvrt,
    output_file_name = output_file_name,
    pvOutputThreshold = pvOutputThreshold,
    useModel = useModel,
    errorCovariance = errorCovariance,
    verbose = TRUE,
    pvalue.hist = TRUE,
    min.pv.by.genesnp = FALSE,
    noFDRsaveMemory = FALSE);

unlink(output_file_name);

## Results:

cat('Analysis done in: ', me$time.in.sec, ' seconds', '\n');
cat('Detected eQTLs:', '\n');
show(me$all$eqtls)

## Plot the histogram of all p-values

plot(me)
Artificial data for Matrix eQTL sample code: Genotype.
Description
Artificial data set with genotype information for 15 markers across 15 samples. Columns of the file must match to those of the gene expression and covariates data sets.
Format
| snpnid | Sam_01 | Sam_02 | ... |
| Snp_01 | 2 | 0 | ... |
| Snp_02 | 0 | 1 | ... |
| ... | ... | ... | ... |
Author(s)
Andrey A Shabalin andrey.shabalin@gmail.com
References
The package website: http://www.bios.unc.edu/research/genomic_software/Matrix_eQTL/
See Also
See Matrix_eQTL_engine for reference and sample code.
Class SlicedData for storing large matrices
Description
This class is created for fast and memory efficient manipulations with large datasets presented in matrix form. It is used to load, store, and manipulate large datasets, e.g. genotype and gene expression matrices. When a dataset is loaded, it is sliced in blocks of 1,000 rows (default size). This allows imputing, standardizing, and performing other operations with the data with minimal memory overhead.
Usage
# x[[i]] indexing allows easy access to individual slices.
# It is equivalent to x$GetSlice(i) and x$SetSlice(i,value)
## S4 method for signature 'SlicedData'
x[[i]]
## S4 replacement method for signature 'SlicedData'
x[[i]] <- value

# The following commands work as if x was a simple matrix object
## S4 method for signature 'SlicedData'
nrow(x)
## S4 method for signature 'SlicedData'
ncol(x)
## S4 method for signature 'SlicedData'
dim(x)
## S4 method for signature 'SlicedData'
rownames(x)
## S4 method for signature 'SlicedData'
colnames(x)
## S4 replacement method for signature 'SlicedData'
rownames(x) <- value
## S4 replacement method for signature 'SlicedData'
colnames(x) <- value

# SlicedData object can be easily transformed into a matrix
# preserving row and column names
## S4 method for signature 'SlicedData'
as.matrix(x)

# length(x) can be used in place of x$nSlices()
# to get the number of slices in the object
## S4 method for signature 'SlicedData'
length(x)
Arguments
x |
|
i |
Number of a slice. |
value |
New content for the slice / new row or column names. |
Extends
SlicedData is a reference classes (envRefClass).
Its methods can change the values of the fields of the class.
Fields
dataEnv:-
environment. Stores the slices of the data matrix. The slices should be accessed viagetSlice()andsetSlice()methods. nSlices1:-
numeric. Number of slices. For internal use. The value should be access vianSlices()method. rowNameSlices:-
list. Slices of row names. columnNames:-
character. Column names. fileDelimiter:-
character. Delimiter separating values in the input file. fileSkipColumns:-
numeric. Number of columns with row labels in the input file. fileSkipRows:-
numeric. Number of rows with column labels in the input file. fileSliceSize:-
numeric. Maximum number of rows in a slice. fileOmitCharacters:-
character. Missing value (NaN) representation in the input file.
Methods
initialize(mat):-
Create the object from a matrix.
nSlices():-
Returns the number of slices.
nCols():-
Returns the number of columns in the matrix.
nRows():-
Returns the number of rows in the matrix.
Clear():-
Clears the object. Removes the data slices and row and column names.
Clone():-
Makes a copy of the object. Changes to the copy do not affect the source object.
CreateFromMatrix(mat):-
Creates
SlicedDataobject from amatrix. LoadFile(filename, skipRows = NULL, skipColumns = NULL,
sliceSize = NULL, omitCharacters = NULL, delimiter = NULL, rowNamesColumn = 1):-
Loads data matrix from a file.
filenameshould be a character string. The remaining parameters specify the file format and have the same meaning asfile*fields. AdditionalrowNamesColumnparameter specifies which of the columns of row labels to use as row names. SaveFile(filename):-
Saves the data to a file.
filenameshould be a character string. getSlice(sl):-
Retrieves
sl-th slice of the matrix. setSlice(sl, value):-
Set
sl-th slice of the matrix. ColumnSubsample(subset):-
Reorders/subsets the columns according to
subset.
Acts asM = M[ ,subset]for a matrixM. RowReorder(ordr):-
Reorders rows according to
ordr.
Acts asM = M[ordr, ]for a matrixM. RowMatrixMultiply(multiplier):-
Multiply each row by the
multiplier.
Acts asM = M %*% multiplierfor a matrixM. CombineInOneSlice():-
Combines all slices into one. The whole matrix can then be obtained via
$getSlice(1). IsCombined():-
Returns
TRUEif the number of slices is 1 or 0. ResliceCombined(sliceSize = -1):-
Cuts the data into slices of
sliceSizerows. IfsliceSizeis not defined, the value offileSliceSizefield is used. GetAllRowNames():-
Returns all row names in one vector.
RowStandardizeCentered():-
Set the mean of each row to zero and the sum of squares to one.
SetNanRowMean():-
Impute rows with row mean. Rows full of NaN values are imputed with zeros.
RowRemoveZeroEps():-
Removes rows of zeros and those that are nearly zero.
FindRow(rowname):-
Finds row by name. Returns a pair of slice number an row number within the slice. If no row is found, the function returns
NULL. rowMeans(x, na.rm = FALSE, dims = 1L):-
Returns a vector of row means. Works as rowMeans but requires
dimsto be equal to1L. rowSums(x, na.rm = FALSE, dims = 1L):-
Returns a vector of row sums. Works as rowSums but requires
dimsto be equal to1L. colMeans(x, na.rm = FALSE, dims = 1L):-
Returns a vector of column means. Works as colMeans but requires
dimsto be equal to1L. colSums(x, na.rm = FALSE, dims = 1L):-
Returns a vector of column sums. Works as colSums but requires
dimsto be equal to1L.
Author(s)
Andrey A Shabalin andrey.shabalin@gmail.com
References
The package website: http://www.bios.unc.edu/research/genomic_software/Matrix_eQTL/
See Also
This class is used to load data for eQTL analysis by
Matrix_eQTL_engine.
Examples
# Create a SlicedData variable
sd = SlicedData$new()

# Show the details of the empty object
show(sd)

# Create a matrix of values and assign to sd
mat = matrix(1:12, 3, 4)
rownames(mat) = c("row1", "row2", "row3")
colnames(mat) = c("col1", "col2", "col3", "col4")
sd$CreateFromMatrix( mat )

# Show the detail of the object (one slice)
show(sd)

# Slice it in pieces of 2 rows
sd$ResliceCombined(sliceSize = 2L)

# Show the number of slices (equivalent function calls)
sd$nSlices()
length(sd)

# Is it all in one slice? (No)
sd$IsCombined()

# Show the column names (equivalent function calls)
sd$columnNames
colnames(sd)

# Show row name slices
sd$rowNameSlices

# Show all row names (equivalent function calls)
sd$GetAllRowNames()
rownames(sd)

# Print the second slice
print(sd[[2]])

# Reorder and subset columns
sd$ColumnSubsample( c(1,3,4) )

# Reorder and subset rows
sd$RowReorder( c(3,1) )

# Show the detail of the object (one slice again)
show(sd)

# Is it all in one slice? (Yes)
sd$IsCombined()

# Find the row with name "row1" (it is second in the first slice)
sd$FindRow("row1")
Artificial data for Matrix eQTL sample code: Gene location file.
Description
Artificial Gene location file for 10 genes.
| geneid | chr | left | right |
| Gene_01 | chr1 | 721289 | 731289 |
| Gene_02 | chr1 | 752565 | 762565 |
| ... | ... | ... | ... |
Format
A data frame with 4 columns.
geneid-
A column with gene names. The order does not have to match the gene expression data set.
chr-
Chromosome number, i.e. chr1.
left-
Lower (smaller) coordinate of the gene begining/end.
right-
Upper (larger) coordinate of the gene begining/end.
Author(s)
Andrey A Shabalin andrey.shabalin@gmail.com
References
The package website: http://www.bios.unc.edu/research/genomic_software/Matrix_eQTL/
See Also
See Matrix_eQTL_engine for reference and sample code.
Constant for Matrix_eQTL_engine.
Description
Set parameter useModel = modelANOVA in the call of
Matrix_eQTL_main to indicate that the genotype
should be treated as a categorical variable.
Note
By default, the number of ANOVA categories is fixed to be 3.
To set it to a different number (say, 4) use the following command:
options(MatrixEQTL.ANOVA.categories=4)
To check the current settings run:
getOption("MatrixEQTL.ANOVA.categories", 3);
References
The package website: http://www.bios.unc.edu/research/genomic_software/Matrix_eQTL/
See Also
See Matrix_eQTL_engine for reference and sample code.
Examples
library("MatrixEQTL")

# Number of columns (samples)
n = 100;

# Number of covariates
nc = 10;

# Generate the standard deviation of the noise
noise.std = 0.1 + rnorm(n)^2;

# Generate the covariates
cvrt.mat = 2 + matrix(rnorm(n*nc), ncol = nc);

# Generate the vectors with single genotype and expression variables
snps.mat = floor(runif(n, min = 0, max = 3));
gene.mat = 1 + (snps.mat==1) + cvrt.mat %*% rnorm(nc) + rnorm(n) * noise.std;

# Create 3 SlicedData objects for the analysis
snps1 = SlicedData$new( matrix( snps.mat, nrow = 1 ) );
gene1 = SlicedData$new( matrix( gene.mat, nrow = 1 ) );
cvrt1 = SlicedData$new( t(cvrt.mat) );

# name of temporary output file
filename = tempfile();

snps1
gene1

# Call the main analysis function
me = Matrix_eQTL_main(
    snps = snps1,
    gene = gene1,
    cvrt = cvrt1,
    output_file_name = filename,
    pvOutputThreshold = 1,
    useModel = modelANOVA,
    errorCovariance = diag(noise.std^2),
    verbose = TRUE,
    pvalue.hist = FALSE );
# remove the output file
unlink( filename );

# Pull Matrix eQTL results - t-statistic and p-value

fstat = me$all$eqtls$statistic;
pvalue = me$all$eqtls$pvalue;
rez = c( Fstat = fstat, pvalue = pvalue)
# And compare to those from ANOVA in R
{
    cat("\n\n Matrix eQTL: \n");
    print(rez);
    cat("\n R anova(lm()) output: \n")
    lmodel = lm( gene.mat ~ cvrt.mat + factor(snps.mat), weights = 1/noise.std^2);
    lmout = anova(lmodel)[2, c("F value", "Pr(>F)")];
    print( lmout )
}

# Results from Matrix eQTL and "lm" must agree
stopifnot(all.equal(lmout, rez, check.attributes = FALSE));
Constant for Matrix_eQTL_engine.
Description
Set parameter useModel = modelLINEAR in the call of
Matrix_eQTL_main to indicate that the effect of
genotype on expression should be assumed to be additive linear.
References
The package website: http://www.bios.unc.edu/research/genomic_software/Matrix_eQTL/
See Also
See Matrix_eQTL_engine for reference and sample code.
Examples
library('MatrixEQTL')

# Number of columns (samples)
n = 100;

# Number of covariates
nc = 10;

# Generate the standard deviation of the noise
noise.std = 0.1 + rnorm(n)^2;

# Generate the covariates
cvrt.mat = 2 + matrix(rnorm(n*nc), ncol = nc);

# Generate the vectors with genotype and expression variables
snps.mat = cvrt.mat %*% rnorm(nc) + rnorm(n);
gene.mat = cvrt.mat %*% rnorm(nc) + rnorm(n) * noise.std + 0.5 * snps.mat + 1;

# Create 3 SlicedData objects for the analysis
snps1 = SlicedData$new( matrix( snps.mat, nrow = 1 ) );
gene1 = SlicedData$new( matrix( gene.mat, nrow = 1 ) );
cvrt1 = SlicedData$new( t(cvrt.mat) );

# name of temporary output file
filename = tempfile();

# Call the main analysis function
me = Matrix_eQTL_main(
    snps = snps1,
    gene = gene1,
    cvrt = cvrt1,
    output_file_name = filename,
    pvOutputThreshold = 1,
    useModel = modelLINEAR,
    errorCovariance = diag(noise.std^2),
    verbose = TRUE,
    pvalue.hist = FALSE );
# remove the output file
unlink( filename );

# Pull Matrix eQTL results - t-statistic and p-value
beta = me$all$eqtls$beta;
tstat = me$all$eqtls$statistic;
pvalue = me$all$eqtls$pvalue;
rez = c(beta = beta, tstat = tstat, pvalue = pvalue)
# And compare to those from the linear regression in R
{
    cat('\n\n Matrix eQTL: \n');
    print(rez);
    cat('\n R summary(lm()) output: \n');
    lmodel = lm( gene.mat ~ snps.mat + cvrt.mat, weights = 1/noise.std^2 );
    lmout = summary(lmodel)$coefficients[2, c("Estimate", "t value", "Pr(>|t|)")];
    print( lmout )
}

# Results from Matrix eQTL and 'lm' must agree
stopifnot(all.equal(lmout, rez, check.attributes = FALSE));
Constant for Matrix_eQTL_engine.
Description
Set parameter useModel = modelLINEAR_CROSS in the call of
Matrix_eQTL_main to indicate that Matrix eQTL should
include the interaction of SNP and the
last covariate in the model and test for its significance.
References
The package website: http://www.bios.unc.edu/research/genomic_software/Matrix_eQTL/
See Also
See Matrix_eQTL_engine for reference and sample code.
Examples
library('MatrixEQTL')

# Number of columns (samples)
n = 25;

# Number of covariates
nc = 10;

# Generate the standard deviation of the noise
noise.std = 0.1 + rnorm(n)^2;

# Generate the covariates
cvrt.mat = 2 + matrix(rnorm(n*nc), ncol = nc);

# Generate the vectors with single genotype and expression variables
snps.mat = cvrt.mat %*% rnorm(nc) + rnorm(n);
gene.mat = cvrt.mat %*% rnorm(nc) + rnorm(n) * noise.std +
            1 + 0.5 * snps.mat + snps.mat * cvrt.mat[,nc];

# Create 3 SlicedData objects for the analysis
snps1 = SlicedData$new( matrix( snps.mat, nrow = 1 ) );
gene1 = SlicedData$new( matrix( gene.mat, nrow = 1 ) );
cvrt1 = SlicedData$new( t(cvrt.mat) );

# name of temporary output file
filename = tempfile();

# Call the main analysis function
me = Matrix_eQTL_main(
    snps = snps1,
    gene = gene1,
    cvrt = cvrt1,
    output_file_name = filename,
    pvOutputThreshold = 1,
    useModel = modelLINEAR_CROSS,
    errorCovariance = diag(noise.std^2),
    verbose = TRUE,
    pvalue.hist = FALSE );
# remove the output file
unlink( filename );

# Pull Matrix eQTL results - t-statistic and p-value
beta = me$all$eqtls$beta;
tstat = me$all$eqtls$statistic;
pvalue = me$all$eqtls$pvalue;
rez = c(beta = beta, tstat = tstat, pvalue = pvalue)
# And compare to those from the linear regression in R
{
    cat('\n\n Matrix eQTL: \n');
    print(rez);
    cat('\n R summary(lm()) output: \n')
    lmodel = lm( gene.mat ~ snps.mat + cvrt.mat + snps.mat*cvrt.mat[,nc],
                    weights = 1/noise.std^2);
    lmout = tail(summary(lmodel)$coefficients,1)[, c("Estimate", "t value", "Pr(>|t|)")];
    print( tail(lmout) );
}

# Results from Matrix eQTL and 'lm' must agree
stopifnot(all.equal(lmout, rez, check.attributes = FALSE));
Plot histogram or QQ-plot of all p-values
Description
This method plots a histogram or QQ-plot of p-values
for all tests performed by Matrix_eQTL_engine.
Usage
## S3 method for class 'MatrixEQTL'
plot(
    x,
    cex = 0.5,
    pch = 19,
    xlim = NULL,
    ylim = NULL,
    main = NULL,
    ...)
Arguments
x |
An object returned by |
cex |
A numerical value giving the amount by which plotting text and symbols should be magnified relative to the default. |
pch |
Plotting "character", i.e., symbol to use.
See |
xlim |
Set the range of the horisontal axis. |
ylim |
Set the range of the vertical axis. |
main |
Plot title. |
... |
Details
The plot type (histogram vs. QQ-plot) is determined by the
pvalue.hist parameter in the call of
Matrix_eQTL_engine function.
Value
The method does not return any value.
Note
The sample code below produces figures like these:
Histogram: 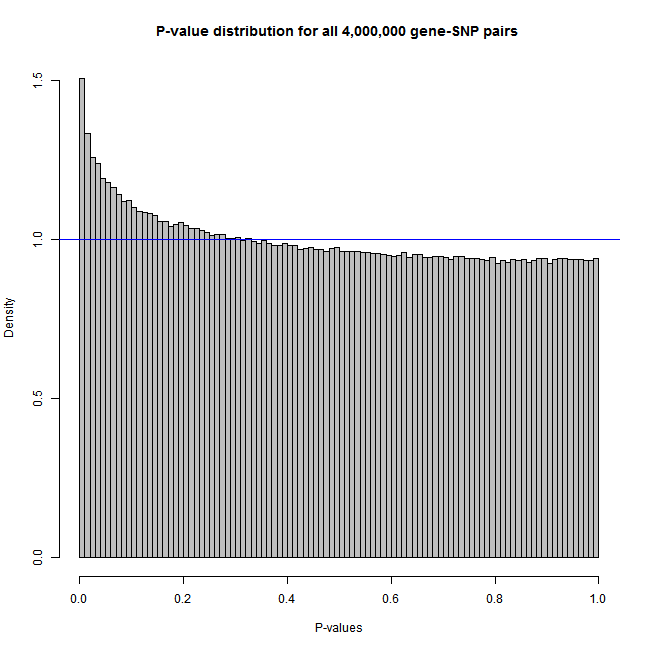
QQ-plot: 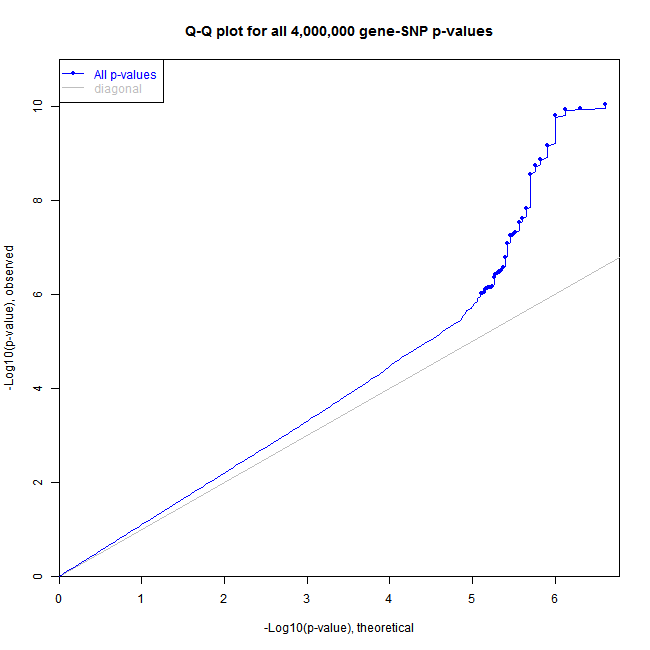
Author(s)
Andrey A Shabalin andrey.shabalin@gmail.com
References
The package website: http://www.bios.unc.edu/research/genomic_software/Matrix_eQTL/
See Also
See Matrix_eQTL_engine for reference and sample code.
Examples
library(MatrixEQTL)

# Number of samples
n = 100

# Number of variables
ngs = 2000

# Common signal in all variables
pop = 0.2*rnorm(n)

# data matrices
snps.mat = matrix(rnorm(n*ngs), ncol = ngs) + pop
gene.mat = matrix(rnorm(n*ngs), ncol = ngs) + pop + snps.mat*((1:ngs)/ngs)^9/2

# data objects for Matrix eQTL engine
snps1 = SlicedData$new( t( snps.mat ) )
gene1 = SlicedData$new( t( gene.mat ) )
cvrt1 = SlicedData$new( )
rm(snps.mat, gene.mat)

# Slice data in blocks of 500 variables
snps1$ResliceCombined(500)
gene1$ResliceCombined(500)

# Produce no output files
filename = NULL # tempfile()

# Perform analysis recording information for a histogram
meh = Matrix_eQTL_engine(
    snps = snps1,
    gene = gene1,
    cvrt = cvrt1,
    output_file_name = filename,
    pvOutputThreshold = 1e-100,
    useModel = modelLINEAR,
    errorCovariance = numeric(),
    verbose = TRUE,
    pvalue.hist = 100)

plot(meh, col="grey")

# Perform analysis recording information for a QQ-plot
meq = Matrix_eQTL_engine(
    snps = snps1,
    gene = gene1,
    cvrt = cvrt1,
    output_file_name = filename,
    pvOutputThreshold = 1e-6,
    useModel = modelLINEAR,
    errorCovariance = numeric(),
    verbose = TRUE,
    pvalue.hist = "qqplot")

plot(meq)
Artificial data for Matrix eQTL sample code: SNP location file.
Description
Artificial SNP location file for 15 markers.
| snpid | chr | pos |
| Snp_01 | chr1 | 721289 |
| Snp_02 | chr1 | 752565 |
| ... | ... | ... |
Format
A data frame with 3 columns.
snpid-
A column with SNP names. The order does not have to match the genotype data set.
chr-
Chromosome number, i.e. chr1.
pos-
Coordinate of the SNP.
Author(s)
Andrey A Shabalin andrey.shabalin@gmail.com
References
The package website: http://www.bios.unc.edu/research/genomic_software/Matrix_eQTL/
See Also
See Matrix_eQTL_engine for reference and sample code.