| Version: | 4.0.1 |
| Date: | 2024-11-14 |
| Title: | Wrapper for 'Visa Chart Components' |
| Description: | Provides a set of wrapper functions for 'Visa Chart Components'. 'Visa Chart Components' https://github.com/visa/visa-chart-components is an accessibility focused, framework agnostic set of data experience design systems components for the web. |
| BugReports: | https://github.com/visa/visa-chart-components/issues |
| License: | MIT + file LICENSE |
| URL: | https://github.com/visa/visa-chart-components/tree/master/packages/charts-R |
| Language: | en-US |
| Encoding: | UTF-8 |
| RoxygenNote: | 7.2.3 |
| Imports: | htmlwidgets |
| Suggests: | dplyr, knitr, rmarkdown, tibble |
| NeedsCompilation: | no |
| Packaged: | 2024-11-15 23:49:32 UTC; davidkutas |
| Author: | Christopher DeMartini [aut, cre], Stephanie Modica [aut], David Kutas [aut], Jaime Tanner [aut], Frank Elavsky [aut], Wojtek Kostelecki [ctb], Visa Data Experience Team [aut, fnd], Visa, Inc. [cph] |
| Maintainer: | Christopher DeMartini <chris.demartini.npm@gmail.com> |
| Repository: | CRAN |
| Date/Publication: | 2024-11-16 00:10:02 UTC |
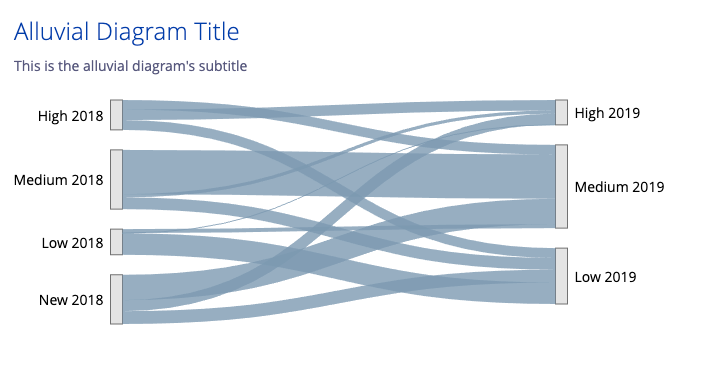
alluvial_diagram
Description
R wrapper for @visa/alluvial-diagram via htmlwidgets.
Here is an example of alluvial-diagram in action:
Usage
alluvial_diagram(
  linkData,
  nodeData = NULL,
  sourceAccessor,
  targetAccessor,
  valueAccessor,
  nodeIDAccessor = "",
  groupAccessor = "",
  mainTitle = "",
  subTitle = "",
  accessibility = list(),
  props = list(),
  ...
)
Arguments
linkData |
required to be a valid, R data frame. Data used to create links in diagram, an array of objects which includes keys that map to chart accessors. See d3-sankey for additional detail on data requirements. |
nodeData |
required to be a valid, R data frame. Optional. Data used to create nodes in diagram, an array of objects which includes key that map to chart accessors. See d3-sankey for additional detail on data requirements. |
sourceAccessor |
String. Key used to determine link's source, must be a node. |
targetAccessor |
String. Key used to determine link's target, must be a node. |
valueAccessor |
String. Key used to determine link (and ultimately node size). |
nodeIDAccessor |
String. Key used to determine unique node identifiers. Requires nodeData to be populated. |
groupAccessor |
String. Key used to determine link's group or category. |
mainTitle |
String. The dynamic tag of title for the map (or you can create your own separately). See |
subTitle |
String. The dynamic tag for a sub title for the map (or you can create your own separately). See |
accessibility |
List(). Manages messages and settings for chart accessibility, see object definition |
props |
List(). A valid R list with additional property configurations, see all props for @visa/alluvial-diagram |
... |
All other props passed into the function will be passed through to the chart, see all props for @visa/alluvial-diagram. |
Details
To see all available options for the chart properties/API see @visa/alluvial-diagram.
Value
a visaNodeLinkChart htmlwidget object for plotting an alluvial diagram
Examples
library(dplyr)
data.frame(HairEyeColor) %>%
  filter(Sex=="Female") %>%
  mutate(newHair = paste(Hair,"-Hair")) %>%
  mutate(newEye = paste(Eye,"-Eye")) %>%
  alluvial_diagram(sourceAccessor = "newHair", targetAccessor = "newEye", valueAccessor = "Freq")
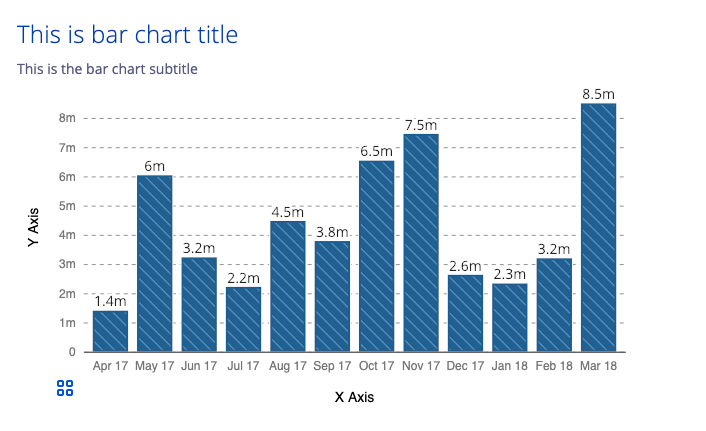
bar_chart
Description
R wrapper for @visa/bar-chart via htmlwidgets.
Here is an example of bar-chart in action:
Usage
bar_chart(
  data,
  ordinalAccessor,
  valueAccessor,
  groupAccessor = "",
  mainTitle = "",
  subTitle = "",
  accessibility = list(),
  props = list(),
  ...
)
Arguments
data |
required to be a valid, R data frame. Data used to create chart, an array of objects which includes keys that map to chart accessors. |
ordinalAccessor |
String. Key used to determine bar's categorical property. (similar to x in ggplot) |
valueAccessor |
String. Key used to determine bar's numeric property. (similar to y in ggplot) |
groupAccessor |
String. Key used to determine bar group encoding (e.g., color/texture). |
mainTitle |
String. The dynamic tag of title for the map (or you can create your own separately). See |
subTitle |
String. The dynamic tag for a sub title for the map (or you can create your own separately). See |
accessibility |
List(). Manages messages and settings for chart accessibility, see object definition |
props |
List(). A valid R list with additional property configurations, see all props for @visa/bar-chart |
... |
All other props passed into the function will be passed through to the chart, see all props for @visa/bar-chart. |
Details
To see all available options for the chart properties/API see @visa/bar-chart.
Value
a visaChart htmlwidget object for plotting a bar chart
Examples
library(dplyr)
bar_chart(BOD, "Time", "demand")
mtcars %>%
  sample_n(5) %>%
  tibble::rownames_to_column() %>%
  bar_chart("rowname", "mpg")
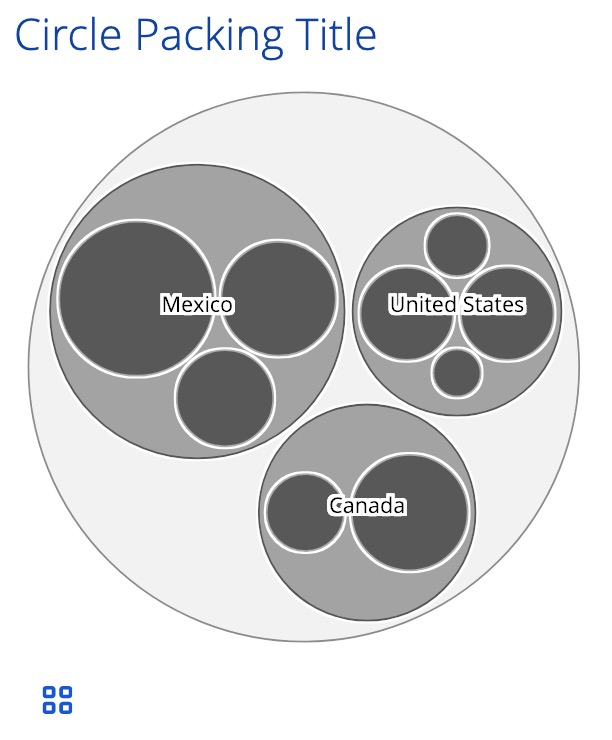
circle_packing
Description
R wrapper for @visa/circle-packing via htmlwidgets.
Here is an example of circle-packing in action:
Usage
circle_packing(
  data,
  nodeAccessor,
  parentAccessor,
  sizeAccessor,
  mainTitle = "",
  subTitle = "",
  accessibility = list(),
  props = list(),
  ...
)
Arguments
data |
required to be a valid, R data frame. Data used to create chart, an array of objects which includes keys that map to chart accessors. See d3-hierarchy.stratify() for additional detail on data requirements. |
nodeAccessor |
String. Key used to determine circle's child, must be a unique child. |
parentAccessor |
String. Key used to determine circle's parent. |
sizeAccessor |
String. Key used to determine circle size. |
mainTitle |
String. The dynamic tag of title for the map (or you can create your own separately). See |
subTitle |
String. The dynamic tag for a sub title for the map (or you can create your own separately). See |
accessibility |
List(). Manages messages and settings for chart accessibility, see object definition |
props |
List(). A valid R list with additional property configurations, see all props for @visa/circle-packing |
... |
All other props passed into the function will be passed through to the chart, see all props for @visa/circle-packing. |
Details
To see all available options for the chart properties/API see @visa/circle-packing.
Value
a visaChart htmlwidget object for plotting a circle packing plot
Examples
library(dplyr)
data.frame(parent = c(NA, "A", "A", "C", "C"),
           node = c("A", "B", "C", "D", "E"),
           size = c(NA, 8L, 7L, 6L, 5L)) %>%
  circle_packing("node", "parent", "size",
                 accessibility = list(hideTextures = TRUE,
                                      hideDataTableButton = TRUE))
library(dplyr)
data.frame(Orange) %>%
  mutate(age = as.character(age)) %>%
  bind_rows(data.frame(Tree = c(rep("Trees", 5), NA),
                       age = c(1:5, "Trees"))) %>%
  circle_packing("age", "Tree", "circumference",
                 accessibility=list(hideTextures = TRUE,
                                    includeDataKeyNames = TRUE,
                                    hideDataTableButton = TRUE))
clustered_bar_chart
Description
R wrapper for @visa/clustered-bar-chart via htmlwidgets.
Here is an example of clustered-bar-chart in action:

Usage
clustered_bar_chart(
  data,
  ordinalAccessor,
  valueAccessor,
  groupAccessor,
  mainTitle = "",
  subTitle = "",
  accessibility = list(),
  props = list(),
  ...
)
Arguments
data |
required to be a valid, R data frame. Data used to create chart, an array of objects which includes keys that map to chart accessors. |
ordinalAccessor |
String. Key used to determine bar's categorical property, within groups. (similar to x in ggplot) |
valueAccessor |
String. Key used to determine bar's numeric property. (similar to y in ggplot) |
groupAccessor |
String. Key used to determine bar clusters. |
mainTitle |
String. The dynamic tag of title for the map (or you can create your own separately). See |
subTitle |
String. The dynamic tag for a sub title for the map (or you can create your own separately). See |
accessibility |
List(). Manages messages and settings for chart accessibility, see object definition |
props |
List(). A valid R list with additional property configurations, see all props for @visa/clustered-bar-chart |
... |
All other props passed into the function will be passed through to the chart, see all props for @visa/clustered-bar-chart. |
Details
To see all available options for the chart properties/API see @visa/clustered-bar-chart.
Value
a visaChart htmlwidget object for plotting a clustered bar chart
Examples
library(dplyr)
data.frame(UCBAdmissions) %>%
  filter(Admit == "Rejected") %>%
  clustered_bar_chart("Gender","Freq","Dept")
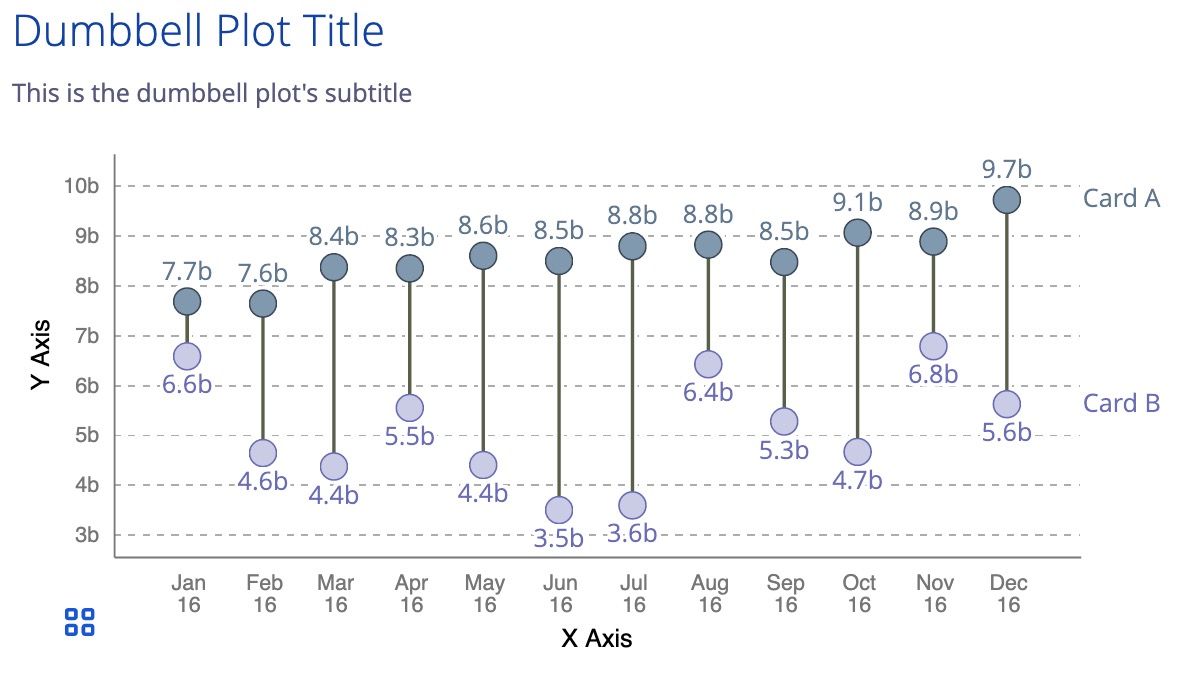
dumbbell_plot
Description
R wrapper for @visa/dumbbell-plot via htmlwidgets.
Here is an example of dumbbell-plot in action:
Usage
dumbbell_plot(
  data,
  ordinalAccessor,
  valueAccessor,
  seriesAccessor,
  mainTitle = "",
  subTitle = "",
  accessibility = list(),
  props = list(),
  ...
)
Arguments
data |
required to be a valid, R data frame. Data used to create chart, an array of objects which includes keys that map to chart accessors. |
ordinalAccessor |
String. Key used to determine dumbbell's categorical property. (similar to x in ggplot) |
valueAccessor |
String. Key used to determine dumbbell's numeric property. (similar to y in ggplot) |
seriesAccessor |
String. Key used to determine dumbbell's series. |
mainTitle |
String. The dynamic tag of title for the map (or you can create your own separately). See |
subTitle |
String. The dynamic tag for a sub title for the map (or you can create your own separately). See |
accessibility |
List(). Manages messages and settings for chart accessibility, see object definition |
props |
List(). A valid R list with additional property configurations, see all props for @visa/dumbbell-plot |
... |
All other props passed into the function will be passed through to the chart, see all props for @visa/dumbbell-plot. |
Details
To see all available options for the chart properties/API see @visa/dumbbell-plot.
Value
a visaChart htmlwidget object for plotting a dumbbell plot
Examples
library(dplyr)
data.frame(UCBAdmissions) %>%
  filter(Admit == "Rejected") %>%
  dumbbell_plot("Dept","Freq","Gender")
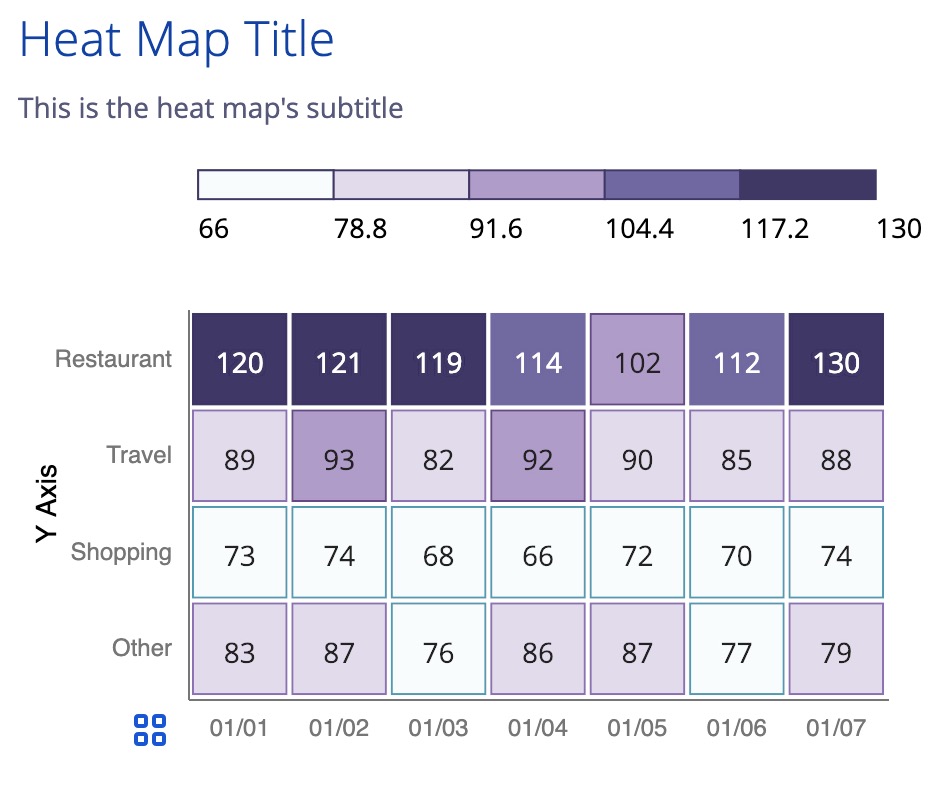
heat_map
Description
R wrapper for @visa/heat-map via htmlwidgets.
Here is an example of heat-map in action:
Usage
heat_map(
  data,
  xAccessor,
  yAccessor,
  valueAccessor,
  mainTitle = "",
  subTitle = "",
  accessibility = list(),
  props = list(),
  ...
)
Arguments
data |
required to be a valid, R data frame. Data used to create chart, an array of objects which includes keys that map to chart accessors. |
xAccessor |
String. Key used to determine the x-axis categorical value. (similar to x in ggplot) |
yAccessor |
String. Key used to determine the y-axis categorical value. (similar to y in ggplot) |
valueAccessor |
String. Key used to determine heatmap's numeric property, for assigning color. |
mainTitle |
String. The dynamic tag of title for the map (or you can create your own separately). See |
subTitle |
String. The dynamic tag for a sub title for the map (or you can create your own separately). See |
accessibility |
List(). Manages messages and settings for chart accessibility, see object definition |
props |
List(). A valid R list with additional property configurations, see all props for @visa/heat-map |
... |
All other props passed into the function will be passed through to the chart, see all props for @visa/heat-map. |
Details
To see all available options for the chart properties/API see @visa/heat-map.
Value
a visaChart htmlwidget object for plotting a heat map
Examples
library(dplyr)
data.frame(UCBAdmissions) %>%
  filter(Admit == "Rejected") %>%
  heat_map("Dept","Gender", "Freq")
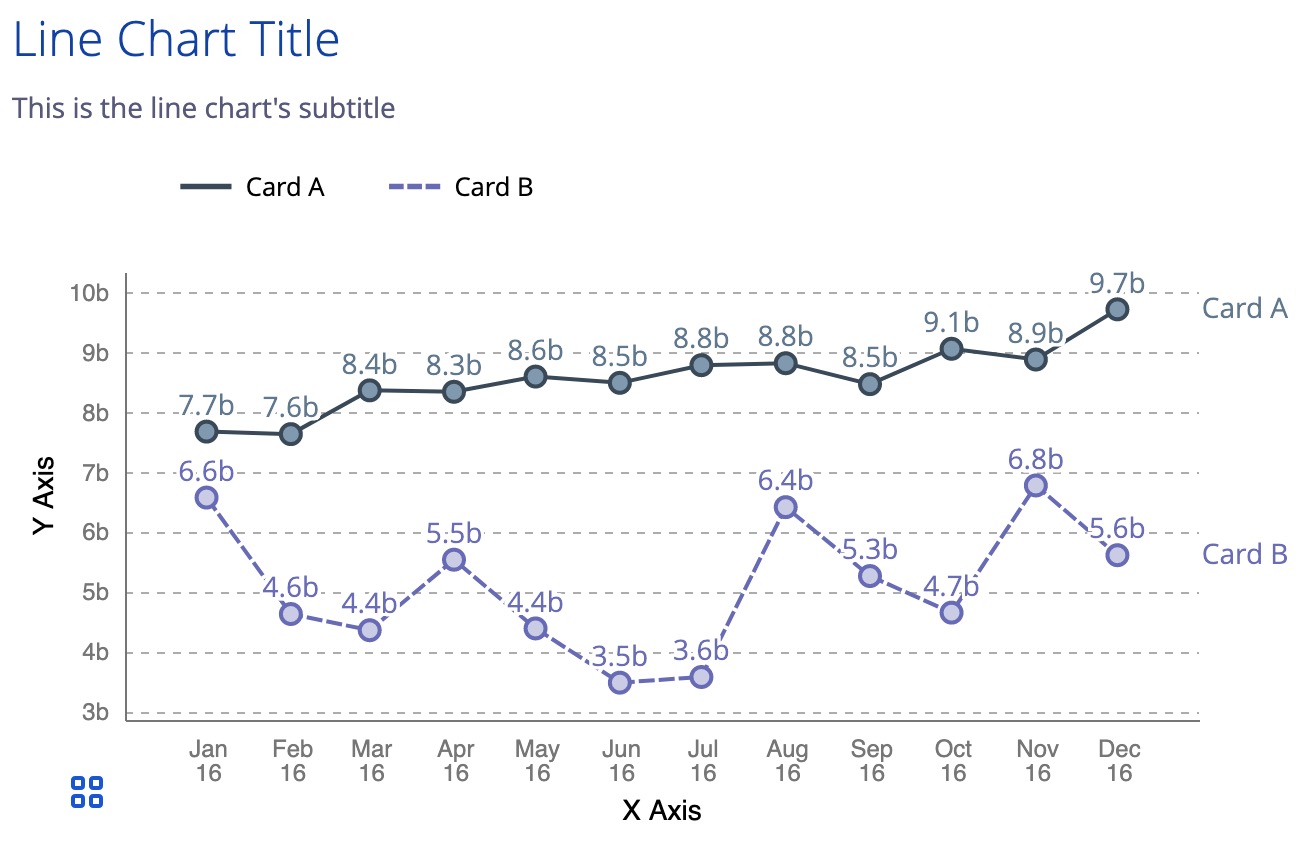
line_chart
Description
R wrapper for @visa/line-chart via htmlwidgets.
Here is an example of line-chart in action:
Usage
line_chart(
  data,
  ordinalAccessor,
  valueAccessor,
  seriesAccessor,
  mainTitle = "",
  subTitle = "",
  accessibility = list(),
  props = list(),
  ...
)
Arguments
data |
required to be a valid, R data frame. Data used to create chart, an array of objects which includes keys that map to chart accessors. |
ordinalAccessor |
String. Key used to determine line's categorical property. (similar to x in ggplot) |
valueAccessor |
String. Key used to determine line's numeric property. (similar to y in ggplot) |
seriesAccessor |
String. Key used to determine series (e.g., color/texture). |
mainTitle |
String. The dynamic tag of title for the map (or you can create your own separately). See |
subTitle |
String. The dynamic tag for a sub title for the map (or you can create your own separately). See |
accessibility |
List(). Manages messages and settings for chart accessibility, see object definition |
props |
List(). A valid R list with additional property configurations, see all props for @visa/line-chart |
... |
All other props passed into the function will be passed through to the chart, see all props for @visa/line-chart. |
Details
To see all available options for the chart properties/API see @visa/line-chart.
Value
a visaChart htmlwidget object for plotting a line chart
Examples
library(dplyr)
ChickWeight %>%
  filter(Chick==1 | Chick == 4) %>%
  line_chart("Time", "weight", "Chick",
             showBaselineX=FALSE,
             xAxis=list(label="Time",format="0a", visible=TRUE),
             yAxis=list(label="Weight", visible=TRUE, gridVisible=TRUE),
             mainTitle = "Selected chick weight over time")
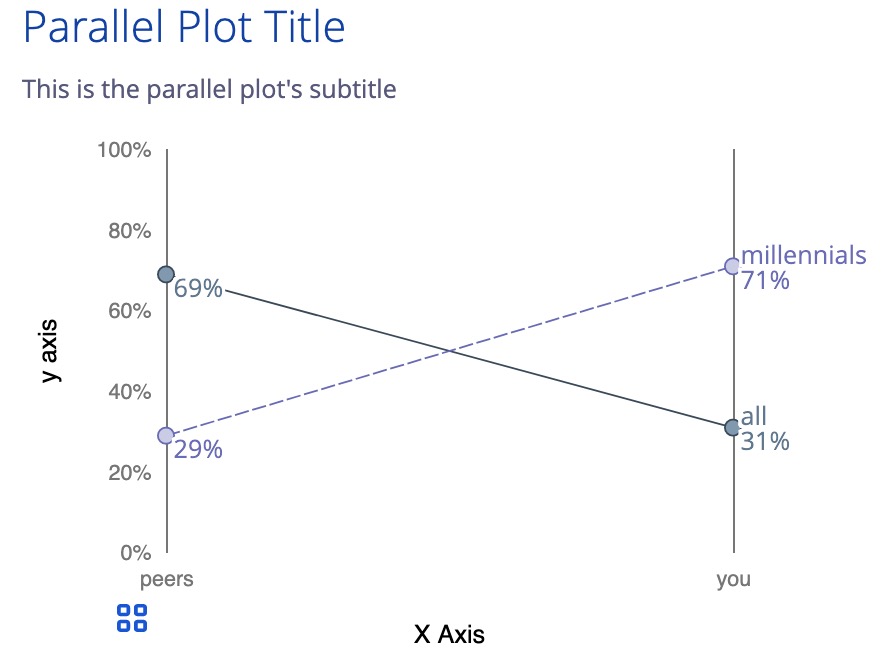
parallel_plot
Description
R wrapper for @visa/parallel-plot via htmlwidgets.
Here is an example of parallel-plot in action:
Usage
parallel_plot(
  data,
  ordinalAccessor,
  valueAccessor,
  seriesAccessor,
  mainTitle = "",
  subTitle = "",
  accessibility = list(),
  props = list(),
  ...
)
Arguments
data |
required to be a valid, R data frame. Data used to create chart, an array of objects which includes keys that map to chart accessors. |
ordinalAccessor |
String. Key used to determine line's categorical property. (similar to x in ggplot) |
valueAccessor |
String. Key used to determine line's numeric property. (similar to y in ggplot) |
seriesAccessor |
String. Key used to determine series (e.g., color/texture). |
mainTitle |
String. The dynamic tag of title for the map (or you can create your own separately). See |
subTitle |
String. The dynamic tag for a sub title for the map (or you can create your own separately). See |
accessibility |
List(). Manages messages and settings for chart accessibility, see object definition |
props |
List(). A valid R list with additional property configurations, see all props for @visa/parallel-plot |
... |
All other props passed into the function will be passed through to the chart, see all props for @visa/parallel-plot. |
Details
To see all available options for the chart properties/API see @visa/parallel-plot.
Value
a visaChart htmlwidget object for plotting a parallel plot
Examples
library(dplyr)
ChickWeight %>%
 filter(Chick==1 | Chick == 4) %>%
 parallel_plot("Time", "weight", "Chick",
               showBaselineX=FALSE,
               xAxis=list(label="Time",format="0a", visible=TRUE),
               yAxis=list(label="Weight", visible=FALSE, gridVisible=FALSE),
               mainTitle = "Selected chick weight over time",
               dataLabel=list(visible = TRUE,
                              labelAccessor = "weight",
                              placement = "bottom-right",
                              format = "0a"))
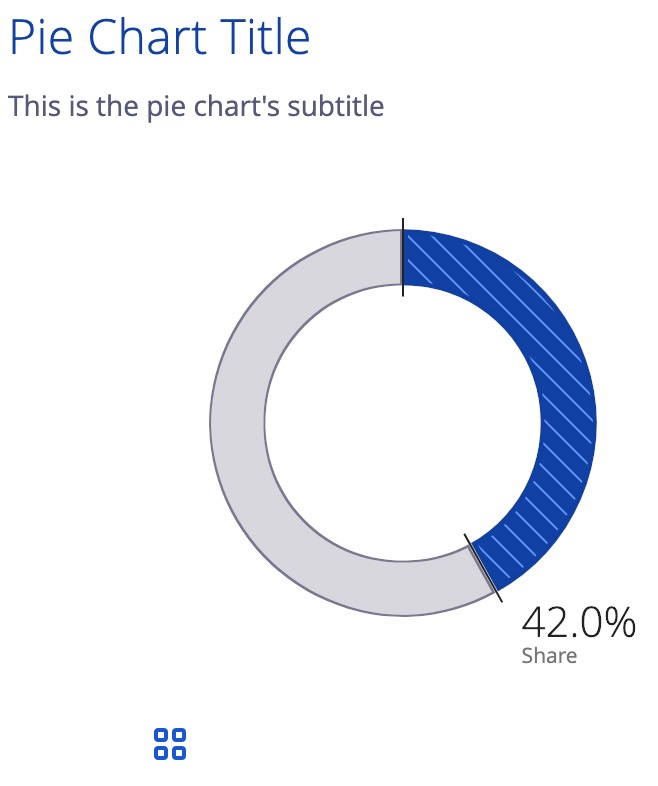
pie_chart
Description
R wrapper for @visa/pie-chart via htmlwidgets.
Here is an example of pie-chart in action:
Usage
pie_chart(
  data,
  ordinalAccessor,
  valueAccessor,
  mainTitle = "",
  subTitle = "",
  accessibility = list(),
  props = list(),
  ...
)
Arguments
data |
required to be a valid, R data frame. Data used to create chart, an array of objects which includes keys that map to chart accessors. |
ordinalAccessor |
String. Key used to determine chart's categorical property. |
valueAccessor |
String. Key used to determine chart's numeric property. |
mainTitle |
String. The dynamic tag of title for the map (or you can create your own separately). See |
subTitle |
String. The dynamic tag for a sub title for the map (or you can create your own separately). See |
accessibility |
List(). Manages messages and settings for chart accessibility, see object definition |
props |
List(). A valid R list with additional property configurations, see all props for @visa/pie-chart |
... |
All other props passed into the function will be passed through to the chart, see all props for @visa/pie-chart. |
Details
To see all available options for the chart properties/API see @visa/pie-chart.
Value
a visaChart htmlwidget object for plotting a pie chart
Examples
library(dplyr)
data.frame (HairEyeColor) %>%
 filter(Hair=="Blond", Sex=="Male") %>%
 mutate(blueEyes = if_else(Eye=="Blue", "Blue","Other")) %>%
 group_by(blueEyes, Hair, Sex) %>%
 summarise(FreqSum=sum(Freq), n=n()) %>%
 pie_chart(
  "blueEyes",
  "FreqSum",
  mainTitle="How many males with Blonde hair have Blue eyes?",
  sortOrder="desc"
 )
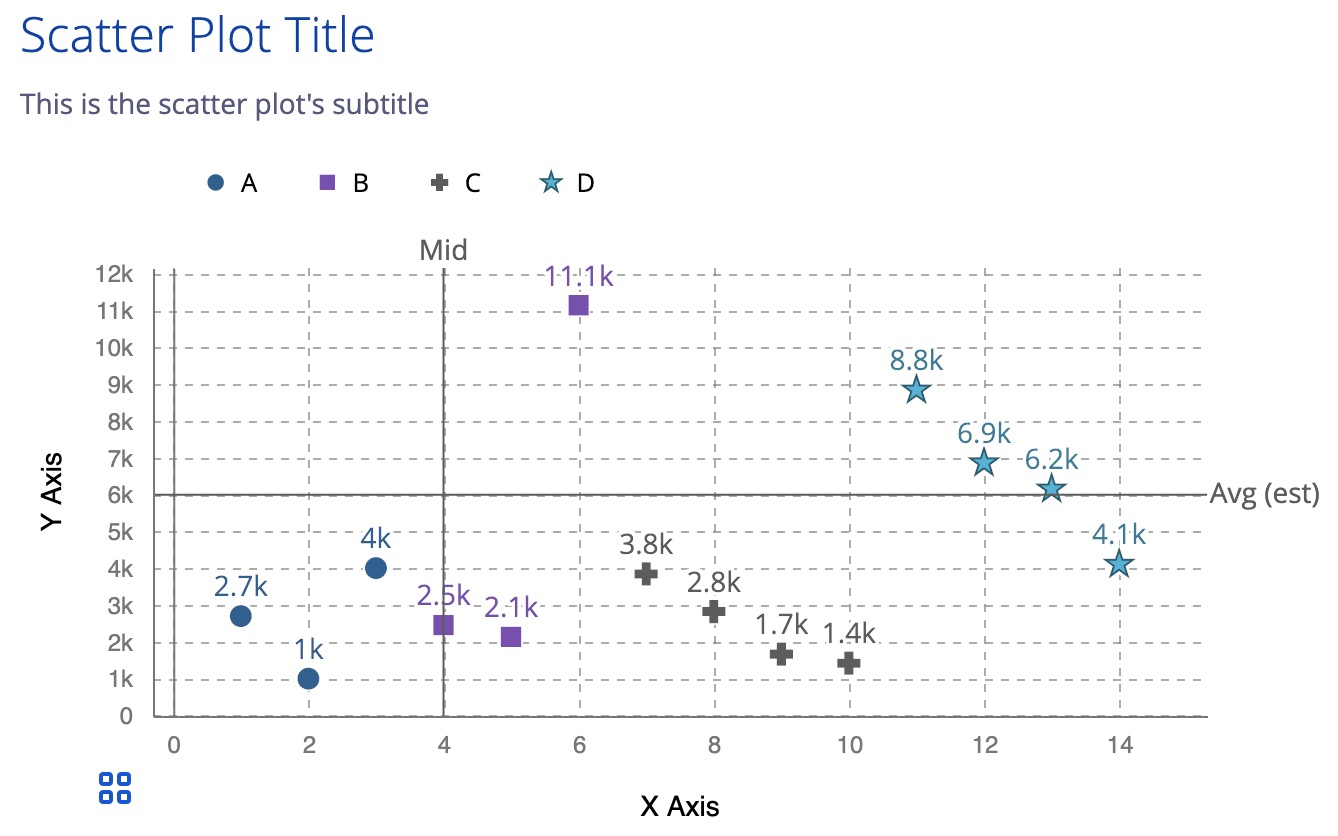
scatter_plot
Description
R wrapper for @visa/scatter-plot via htmlwidgets.
Here is an example of scatter-plot in action:
Usage
scatter_plot(
  data,
  xAccessor,
  yAccessor,
  groupAccessor = "",
  mainTitle = "",
  subTitle = "",
  accessibility = list(),
  props = list(),
  ...
)
Arguments
data |
required to be a valid, R data frame. Data used to create chart, an array of objects which includes keys that map to chart accessors. |
xAccessor |
String. Key used to determine each point's position along the x-axis. |
yAccessor |
String. Key used to determine each point's position along the y-axis. |
groupAccessor |
String. Key used to determine bar group encoding (e.g., color/texture). |
mainTitle |
String. The dynamic tag of title for the map (or you can create your own separately). See |
subTitle |
String. The dynamic tag for a sub title for the map (or you can create your own separately). See |
accessibility |
List(). Manages messages and settings for chart accessibility, see object definition |
props |
List(). A valid R list with additional property configurations, see all props for @visa/scatter-plot |
... |
All other props passed into the function will be passed through to the chart, see all props for @visa/scatter-plot. |
Details
To see all available options for the chart properties/API see @visa/scatter-plot.
Value
a visaChart htmlwidget object for plotting a scatter plot
Examples
library(dplyr)
scatter_plot(mtcars[order(mtcars$cyl),], "wt", "mpg", "cyl")
stacked_bar_chart
Description
R wrapper for @visa/stacked-bar-chart via htmlwidgets.
Here is an example of stacked-bar-chart in action:

Usage
stacked_bar_chart(
  data,
  ordinalAccessor,
  valueAccessor,
  groupAccessor,
  mainTitle = "",
  subTitle = "",
  accessibility = list(),
  props = list(),
  ...
)
Arguments
data |
required to be a valid, R data frame. Data used to create chart, an array of objects which includes keys that map to chart accessors. |
ordinalAccessor |
String. Key used to determine bar's categorical property, within groups. (similar to x in ggplot) |
valueAccessor |
String. Key used to determine bar's numeric property. (similar to y in ggplot) |
groupAccessor |
String. Key used to determine bar clusters. |
mainTitle |
String. The dynamic tag of title for the map (or you can create your own separately). See |
subTitle |
String. The dynamic tag for a sub title for the map (or you can create your own separately). See |
accessibility |
List(). Manages messages and settings for chart accessibility, see object definition |
props |
List(). A valid R list with additional property configurations, see all props for @visa/stacked-bar-chart |
... |
All other props passed into the function will be passed through to the chart, see all props for @visa/stacked-bar-chart. |
Details
To see all available options for the chart properties/API see @visa/stacked-bar-chart.
Value
a visaChart htmlwidget object for plotting a stacked bar chart
Examples
library(dplyr)
data.frame(UCBAdmissions) %>%
  filter(Admit == "Rejected") %>%
  stacked_bar_chart("Gender", "Freq", "Dept")
visa charts 5.0.5
Description
Visa Chart Components wrapped in r htmlwidgets package
Usage
visaChart(tagName, data, propList, width = NULL, height = NULL, ...)
Arguments
tagName |
String. The custom web component HTML tag for the Visa Chart Component. Set by respective chart functions. |
data |
a valid R data frame. See more details in respective component functions. |
propList |
a list of props, created by each component function, see Visa Chart Components. |
width |
Number. Width of chart container. |
height |
Number. Height of chart container. |
... |
All other props passed into the function will be passed through to the chart. |
Value
a visaChart htmlwidget object for creating a variety of plot types
Shiny bindings for visaChart
Description
Output and render functions for using visaChart within Shiny applications and interactive Rmd documents.
Usage
visaChartOutput(outputId, width = "100%", height = "400px")

renderVisaChart(expr, env = parent.frame(), quoted = FALSE)
Arguments
outputId |
output variable to read from |
width, height |
Must be a valid CSS unit (like |
expr |
An expression that generates a visaChart |
env |
The environment in which to evaluate |
quoted |
Is |
Value
a Shiny output or render function for visaChart htmlwidgets
visa charts 5.0.5
Description
Visa Chart Components wrapped in r htmlwidgets package
Usage
visaNodeLinkChart(
  tagName,
  linkData,
  nodeData,
  propList,
  width = NULL,
  height = NULL,
  ...
)
Arguments
tagName |
String. The custom web component HTML tag for the Visa Chart Component. Set by respective chart functions. |
linkData |
a valid R data frame. See more details in respective component functions. |
nodeData |
a valid R data frame. See more details in respective component functions. |
propList |
a list of props, created by each component function, see Visa Chart Components. |
width |
Number. Width of chart container. |
height |
Number. Height of chart container. |
... |
All other props passed into the function will be passed through to the chart. |
Value
a visaNodeLinkChart htmlwidget object for creating a variety of plot types
Shiny bindings for visaNodeLinkChart
Description
Output and render functions for using visaNodeLinkChart within Shiny applications and interactive Rmd documents.
Usage
visaNodeLinkChartOutput(outputId, width = "100%", height = "400px")

rendervisaNodeLinkChart(expr, env = parent.frame(), quoted = FALSE)
Arguments
outputId |
output variable to read from |
width, height |
Must be a valid CSS unit (like |
expr |
An expression that generates a visaNodeLinkChart |
env |
The environment in which to evaluate |
quoted |
Is |
Value
a Shiny output or render function for visaNodeLinkChart htmlwidgets
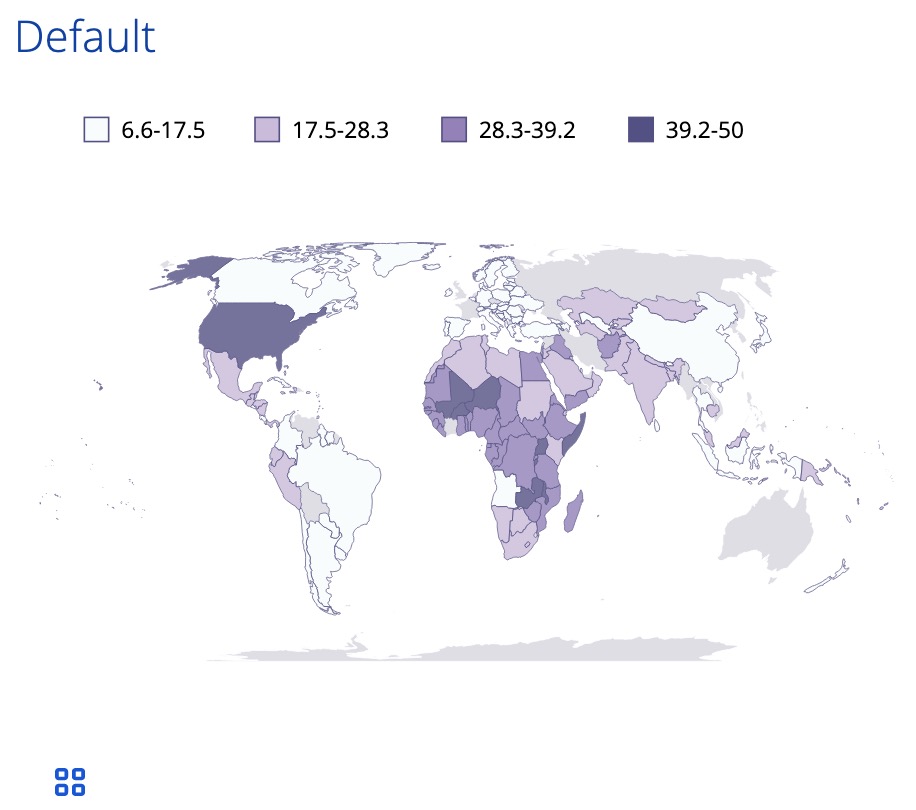
world_map
Description
R wrapper for @visa/world-map via htmlwidgets.
Here is an example of world-map in action:
Usage
world_map(
  data,
  joinAccessor = "",
  joinNameAccessor = "",
  markerAccessor = "",
  markerNameAccessor = "",
  latitudeAccessor = "",
  longitudeAccessor = "",
  valueAccessor,
  groupAccessor = "",
  mainTitle = "",
  subTitle = "",
  accessibility = list(),
  props = list(),
  ...
)
Arguments
data |
required to be a valid, R data frame. Data used to create chart, an array of objects which includes keys that map to chart accessors. |
joinAccessor |
String. Key used to determine country's key property (ISO 3-Digit Code). |
joinNameAccessor |
String. Key used to determine country's name property. |
markerAccessor |
String. Key used to determine marker's key property. |
markerNameAccessor |
String. Key used to determine marker's name property. |
latitudeAccessor |
String. Key used to determine marker's latitude property. |
longitudeAccessor |
String. Key used to determine marker's longitude property. |
valueAccessor |
String. Key used to determine the country/marker's numeric property. |
groupAccessor |
String. Key used to determine country/marker color. |
mainTitle |
String. The dynamic tag of title for the map (or you can create your own separately). See |
subTitle |
String. The dynamic tag for a sub title for the map (or you can create your own separately). See |
accessibility |
List(). Manages messages and settings for chart accessibility, see object definition |
props |
List(). A valid R list with additional property configurations, see all props for @visa/world-map |
... |
All other props passed into the function will be passed through to the chart, see all props for @visa/world-map. |
Details
To see all available options for the chart properties/API see @visa/world-map.
Value
a visaChart htmlwidget object for plotting a world map
Examples
library(dplyr)
quakes %>%
 sample_n(100) %>%
 tibble::rowid_to_column() %>%
 world_map(
   markerAccessor = "rowid",
   latitudeAccessor = "long",
   longitudeAccessor = "lat",
   valueAccessor = "stations",
   markerStyle=list(
    visible=TRUE,
    fill=TRUE,
    opacity=.5,
    radiusRange=c(5,15)
   )
 )